AFDE_20250411_Copenhagen_Nanosystems_Logo_Tagline_Regular
Get started.
Log in - SpectroWorks
JUST LANDED

Say hello to the next generation of UV-Vis spectral analysis. Designed for research, education, and production, it turns any spectrophotometer into a powerful multi-parameter analytical platform.

PHOT_20251204_marketing_7_Automated_Reporting_and_Traceability
PHOT_20251204_marketing_1_Automated_Data_Processing_and_Standardization_Simple

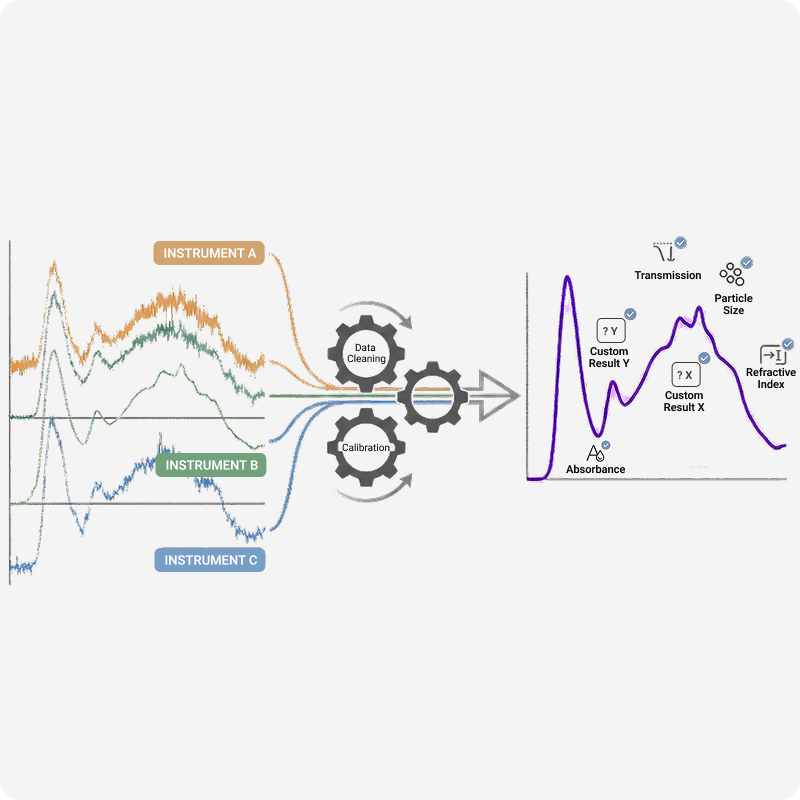
Automated Data Processing & Results

Automatically cleans, aligns, and standardizes spectral data from multiple instruments, delivering high-quality, consistent datasets and results.
PHOT_20251204_marketing_4_Seamless_Integration_with_SpectroLinkTM_and_Supported_Instruments

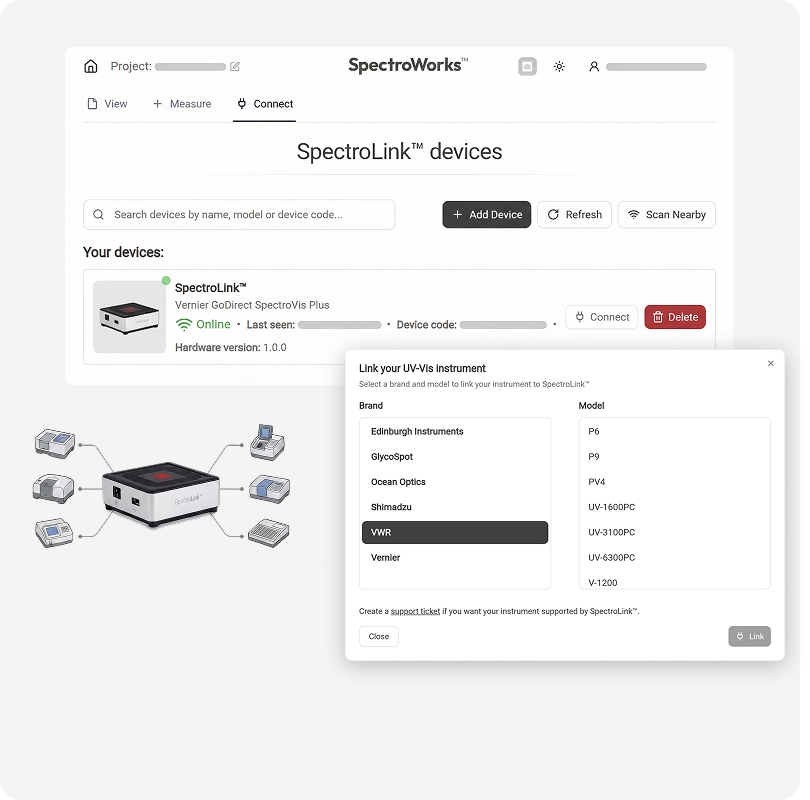
Seamless Integration with UV-Vis Instruments via SpectroLink™

Connect directly to SpectroLink™ and supported instruments. Automate upload, processing, and analysis without manual handling of software or data.
PHOT_20251204_marketing_3_Real_Time_Interpretation_Visualization

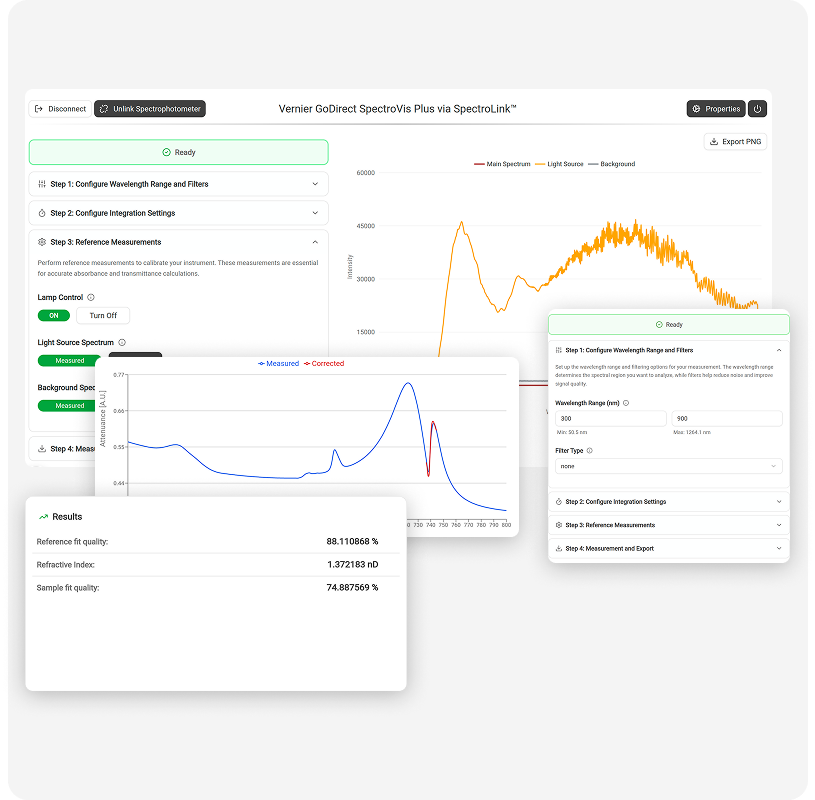
Real-Time Interpretation & Visualization

Interactive browser-based plots for expert and everyday users, visualizing spectra and calibration results instantly.
PHOT_20251204_marketing_2_Advanced_Optical_and_Particle_Size_Analysis

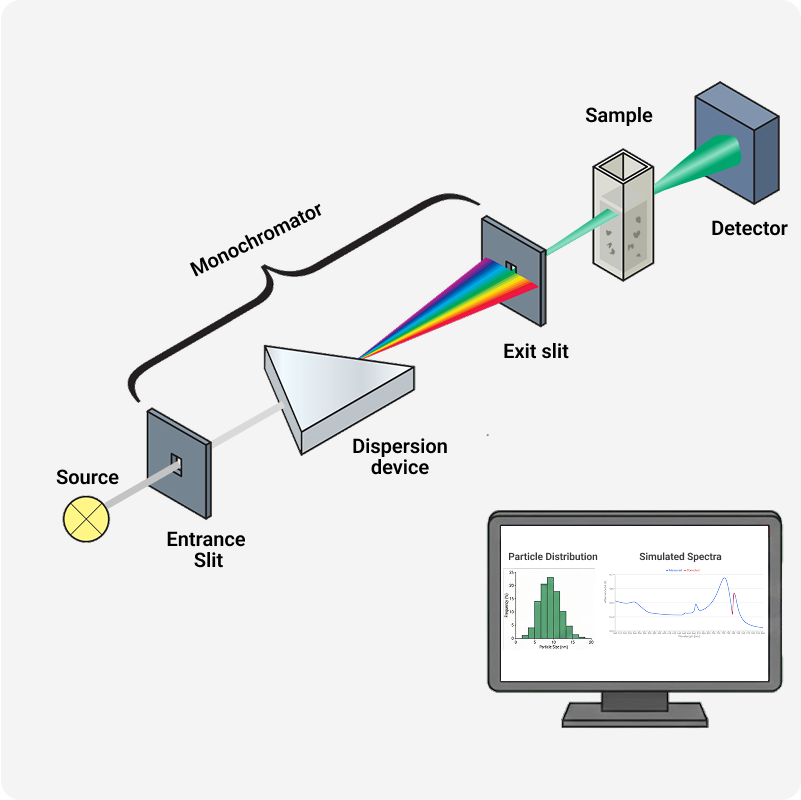
Advanced Optical & Particle Size Analysis

Scientifically validated tools for lab-grade quantification. From refractive index modeling to scattering analysis and chemometrics.
NanoCuvette™ One
NanoCuvette™ One

Liquid Analysis

Learn more
NanoCuvette™ S
NanoCuvette™ S

Particle Analysis

Learn more
SpectroLink™
SpectroLink™

Smart Connectivity

Learn more
SpectroShell™
SpectroShell™

Housing upgrade

Learn more
SpectroWorks™
SpectroWorks™

Web-based software

Learn more
pySpectroWorks™
pySpectroWorks™

Python module

Learn more
SpectroPlus™
SpectroPlus™

Courses & lectures

SpectroKnowledge™
SpectroKnowledge™

Database & library

Learn more

Easy & Secure

Simplify Your UV-Vis Workflow and Save Hours In The Lab

SpectroWorks™ simplifies your spectrophotometer workflow to a three step process allowing you to quickly acquire, analyze and extract results.

It includes instrument light simulations for better performance and easy sharing of data with spreadsheets, electronic lab notebooks, and python etc.

With 99.99 % uptime worldwide, SpectroWorks™ is a reliable tool for the analytical laboratory. SpectroWorks™ effortlessly analyses the data, so you can focus on the work.

SpectroWorks vie page shown from a laptop perspective

Workflows for all types of UV-Vis analysis

Analyze All Cuvettes With One Platform

BLEN_20210812_basic_cuvette

Basic cuvette

With the basic cuvette workflow all standard UV-Vis measurements can be analysed for all types of plastic, glass or quartz cuvettes.

Free analysis

BLEN_20210812_nanocuvette_one

NanoCuvette™ One

NanoCuvette™ One enables UV-Vis spectrophotometers to measure protein and enzyme concentrations and kinetics via refractive index down to 0.5 µL.

Free analysis with purchase of cuvette

BLEN_20210812_nanocuvette_s_microcuvette

NanoCuvette™ S

NanoCuvette™ S enables UV-Vis spectrophotometers to measure particle and cell size distributions for 100 µL samples.

Free analysis with purchase of cuvette

PHOT_20251204_marketing_9_Multi_Parameter_Capability_Beyond_Absorbance

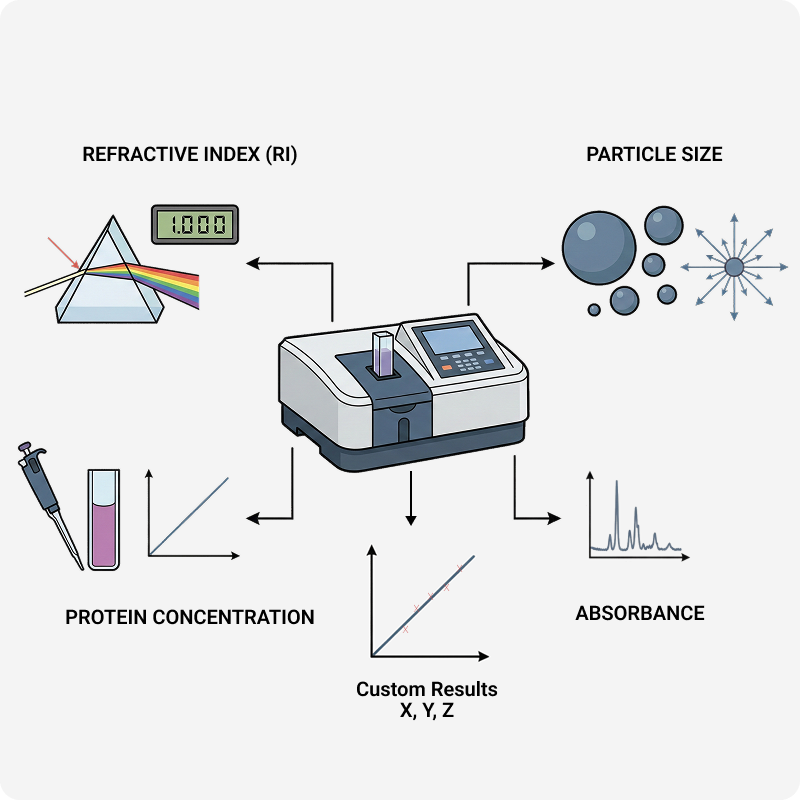
Multi-Parameter Capability Beyond Absorbance

Turns a standard spectrophotometer into a multi-tool. When paired with NanoCuvettes™, calculates Refractive Index, Particle Size, and Protein Concentration.
PHOT_20251204_marketing_10_Digital_Interface_Across_UV_Vis_Instruments

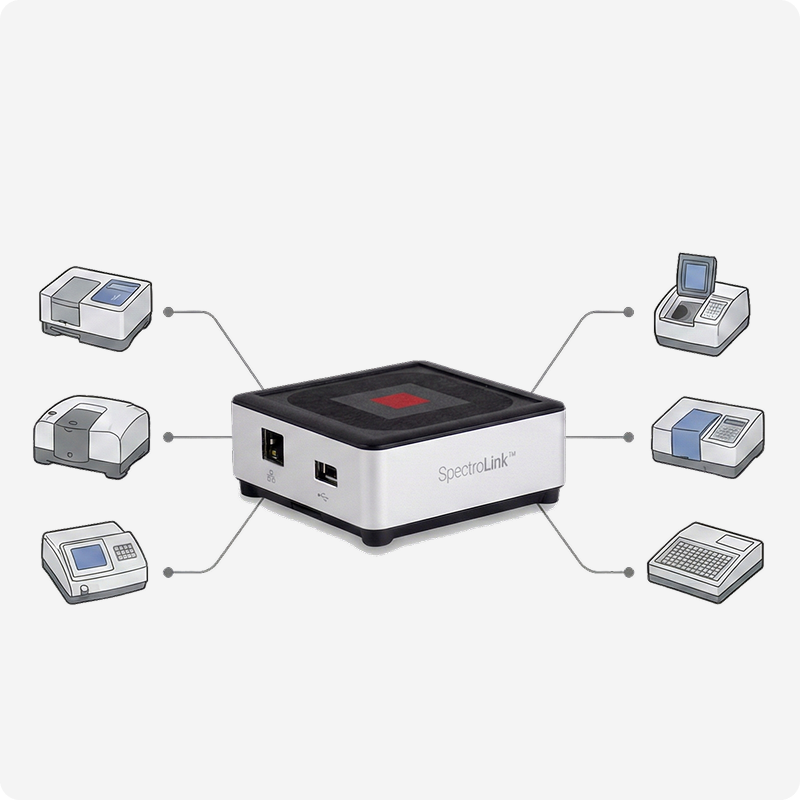
Digital Interface Across UV-Vis Instruments

Digitize your existing hardware and control your entire fleet from the cloud. Works with older or mixed-brand spectrophotometers.
PHOT_20251204_marketing_11_Zero_Install_Cloud_Accessibility

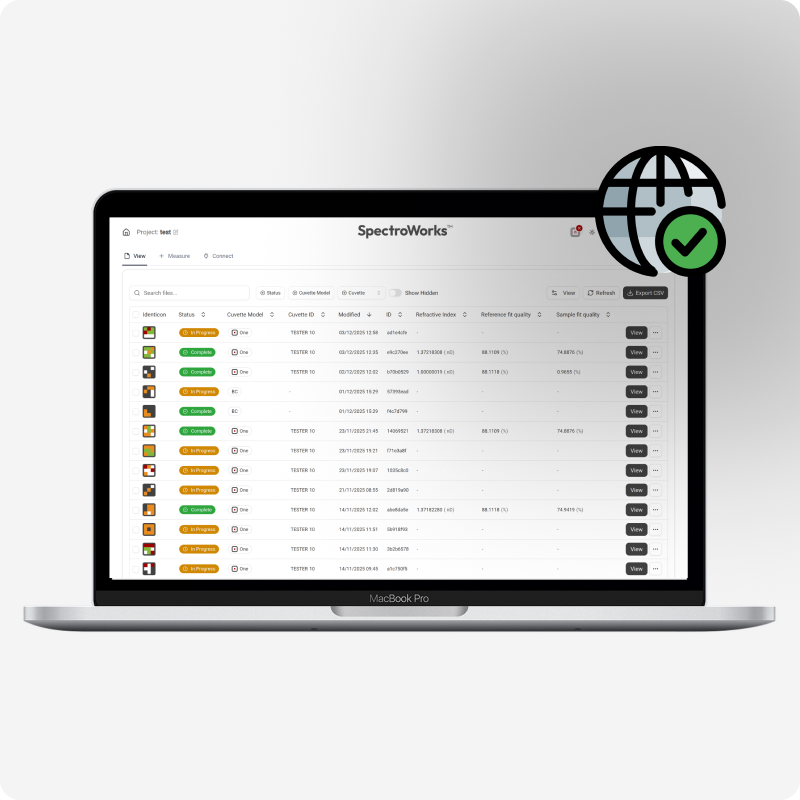
Zero-Install Cloud Accessibility

Eliminates IT headaches by running entirely in the browser with no drivers, CDs, or local installation needed.
PHOT_20251204_marketing_19_Multi_device_support

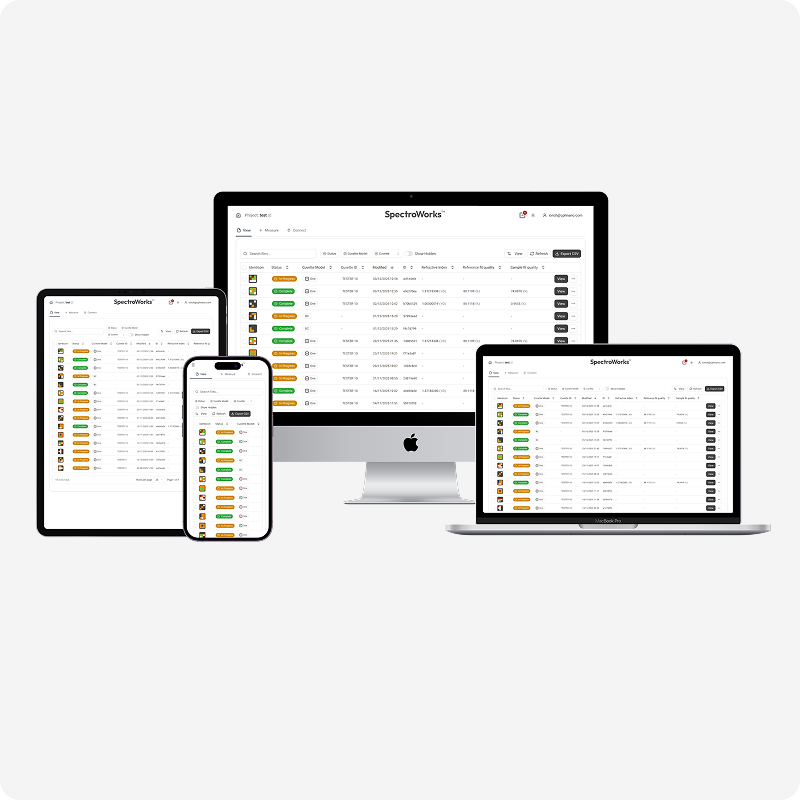
Multi-device support

Access and control your lab workflow from laptops, tablets, and smartphones, ensuring flexibility and productivity wherever you are.
PHOT_20251204_marketing_17_Advanced_Data_Export_and_Custom_Reporting

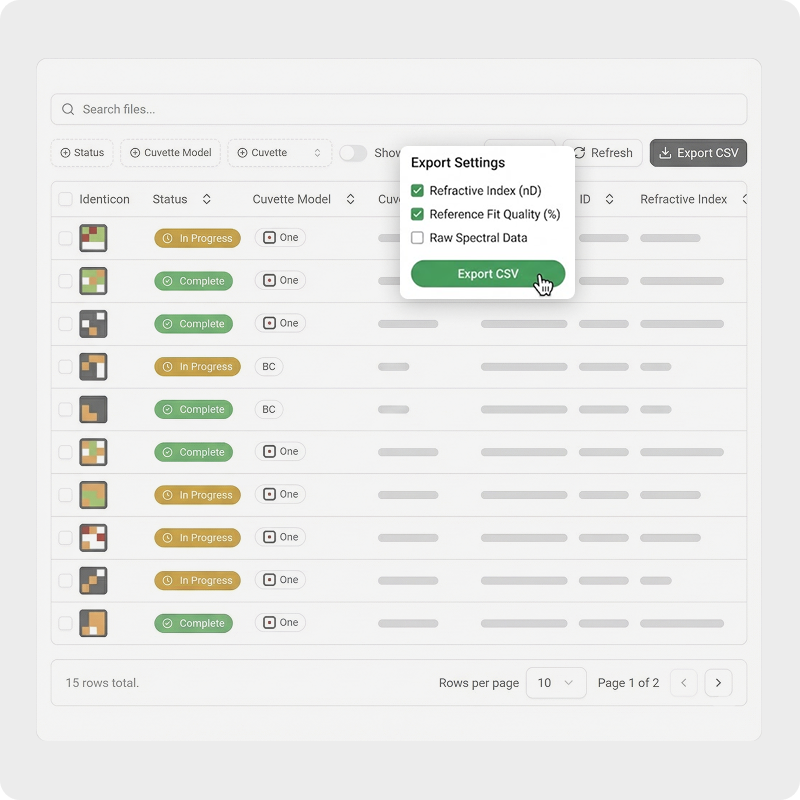
Advanced Data Export & Custom Reporting

Generate PDF, PNG, or CSV reports with full metadata, customizable layouts, and lab branding.
PHOT_20251204_marketing_15_Project_and_Sample_Management_Dashboard

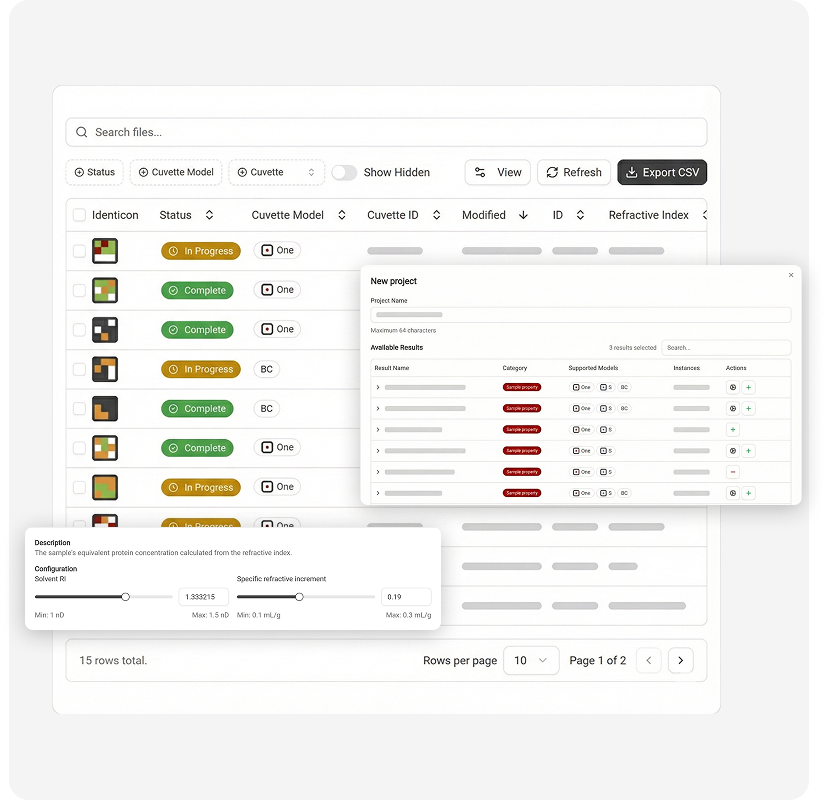
Project & Sample Management Dashboard

Centralized project management to track experiments, samples, and workflows with complete visibility.
PHOT_20251204_12_Seamless_data_access_and_Native_Python_Integration

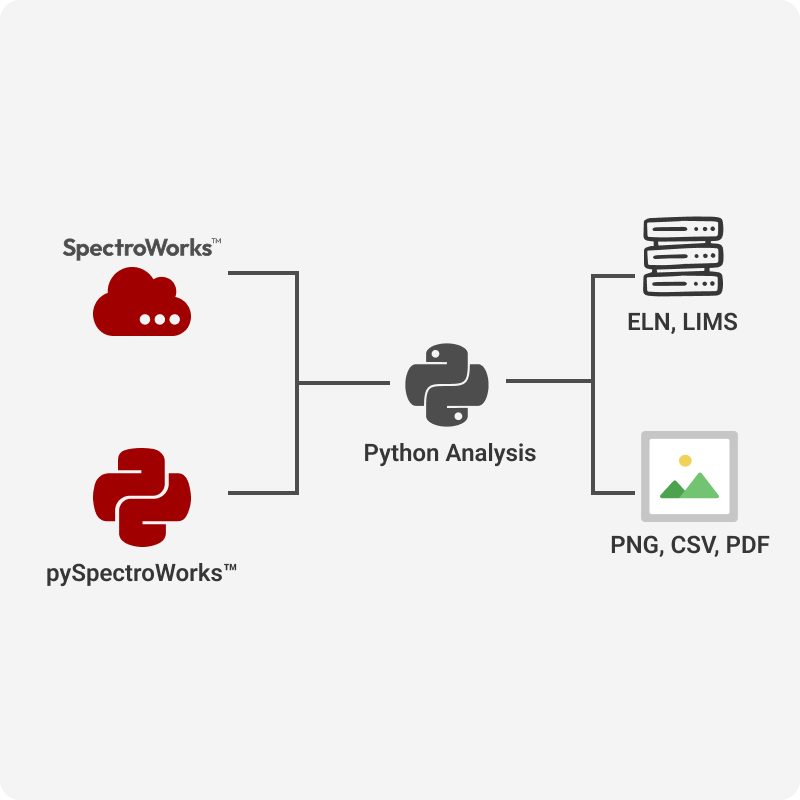
Seamless data access & Native Python Integration

Access your SpectroWorks™ data directly from Python using pySpectroWorks, our native Python package available on PyPI. Automate workflows, integrate with ELN/LIMS systems, and streamline data handling with no custom setup required.
PHOT_20251204_marketing_7_Automated_Reporting_and_Traceability

Traceability & Secure Collaboration

Share results instantly while maintaining a secure, traceable digital thread for every measurement.
PHOT_20251204_marketing_16_Dark_and_Light_Viewing_Modes

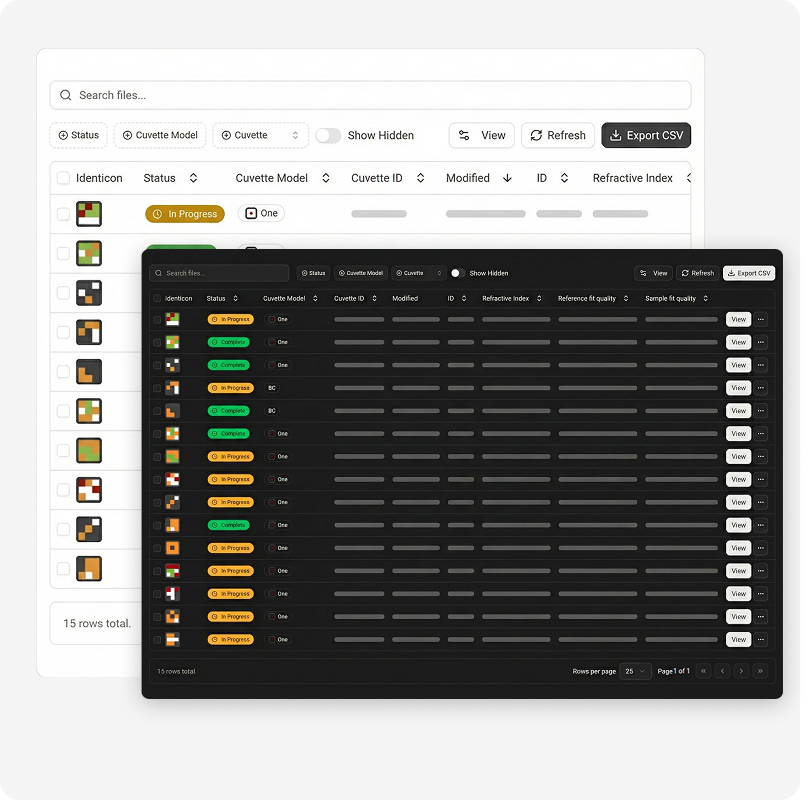
Dark and Light Viewing Modes

Reduce eye strain and improve readability in dim or bright labs with switchable interface modes.

Why Choose Us?

BLEN_20210813_nanocuvette_animations_basic_sample_a
EXTF_20210413_Font_Awesome_box_check_Red
Supports Your Hardware

SpectroWorks™ works with your existing UV-Vis spectrophotometer. 

EXTF_20210413_Font_Awesome_users_Red
Designed For Humans

Easy to use with no special training required. Online support included.

EXTF_20210413_Font_Awesome_chart_line_Red
Accurate and Instant Results

Results are calculated based on spectral analysis in less than 5 seconds.

EXTF_20210413_Font_Awesome_line_columns_red
Safe & Secure

SpectroWorks™ uses the up-to-date web technologies to ensure your data is secure.

How It Works

Perform UV-Vis Analysis On All Devices With One Click

SpectroWorks™ is drag-and-drop easy to use on all devices. With SpectroWorks™ you get one-click results in seconds, so you can focus on getting things done.

Optionally, SpectroWorks™ automatically analyses the spectrum, corrects for optical path and cuvette misalignments by accessing 200 million calibration points, and gives back the result – all in less than 5 seconds.

After analysis, you can export the results in spreadsheet format or use API-keys to interface with other platforms, see for example our Colab python notebooks on standard curves.

Multi Device view file View SpectroWorks

Testimonials

I think, it’s a game changer in this industry. Palak Sehgal, CSO, Nordetect
The NanoCuvette™ products and its associated online analysis software provide students a unique possibility to learn how to operate and understand big data in the future. Lone Bruun, PhD, Publisher, Epsilon
A new and innovative solution to our customers, which saves time and gives more reliable results. Jan Locher, CEO, Hounisen
PHOT_20210505_vwr_webinar_photoshoot_02_square

Want more info?

See How SpectroWorks™ Can Speed Up Your Labwork